Sample demo
Elevators
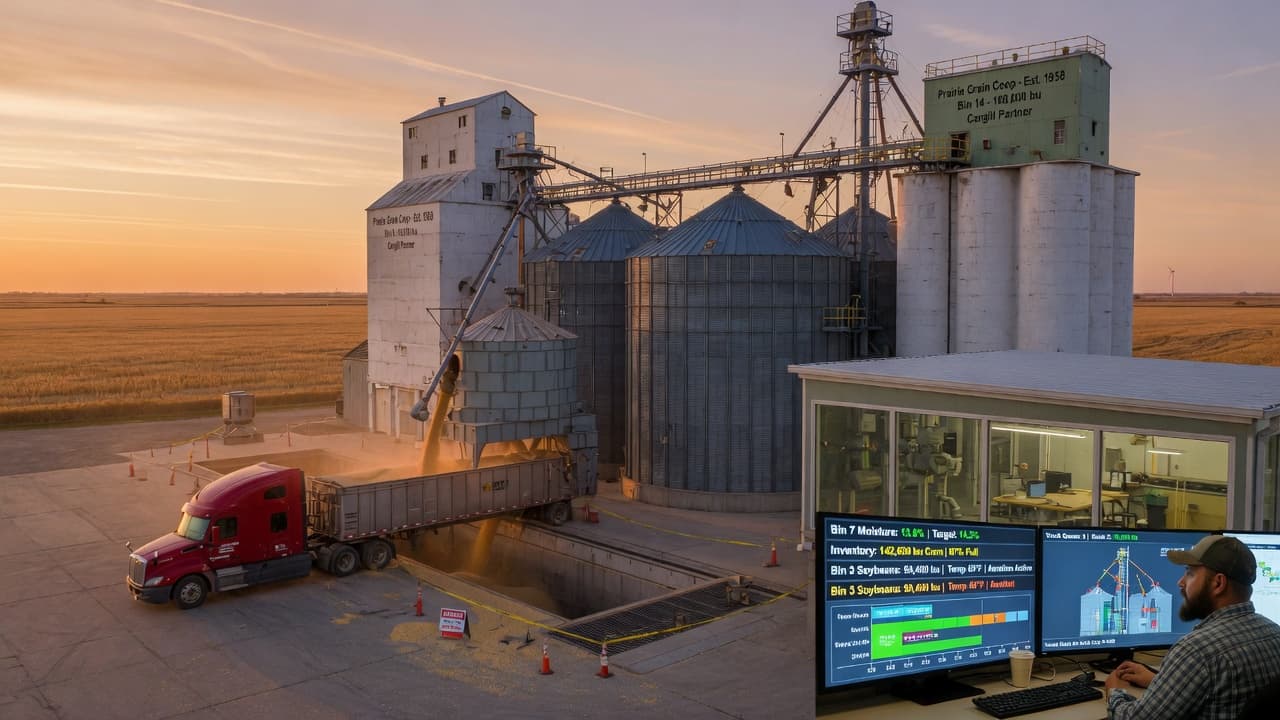
The grain facility twin: sonar levels beside ticket inventory and modeled outbound grade. Sample data; no equipment is connected or controlled.
Grain elevator intelligence
They count bushels. We model what comes out of the bin.
Scale tickets + grade factors + accounting bin assignment + live level sensors → weight-averaged composition and FIFO forecasted outbound grade on every ship ticket. Built so the facility owns the process IP — not another locked SaaS silo.
3D digital twin
Walk the facility in the model
Live fill from sensor %. Selected bin rings gold. Drag to orbit — same bins as the recon board below. Demo site only; no real site identity.
Live facility flow
From truck scale to processor ticket — with eyes on the bin
Elite elevators don't only ask “how many bushels?” They ask “what grade comes out when we load this truck?” Stack every load as a layer, fuse live level sensors, forecast outbound grade with FIFO math.
Scale & grade in
Every inbound load captures ticket weight plus moisture, FM, damage, test weight — not just pounds.
Intake →Assign bin
Accounting or scale house says which bin. Layers stack FIFO so composition stays honest.
Loads →Model the pile
Weight-averaged grade across remaining inventory. Moisture risk flags spoil risk before you ship.
Bins →Ship with forecast
Outbound ticket gets FIFO-forecasted grade so processors see what should come out — not a spreadsheet guess.
Ship →Sensors on the bin
Level sonar sees fill — the model sees quality
Ultrasonic / radar / cable sensors report how full the bin is (level %). That alone is what most bin-monitor products stop at.
We ingest the same signal over a webhook (POST /api/integrations/sonar) and show it next to weight-averaged grade from every load still in the bin. Quantity from the sensor. Quality from the ledger. Outbound from both.
- Sensor: level % → capacity planning, overflow risk, reconcile vs model bu
- Model: moisture / FM / damage layers → what processors actually buy
- Draw: FIFO forecast attaches expected grade to the ship ticket
North 1 · Corn
sonar tickMounted in roof / hatch — measures freeboard → fill %
FIFO layers (oldest at bottom)
Live from sonar / radar webhook
From scale tickets still remaining in bin
Live facility
Site A · Grain facility
Confidential location · Model inventory + sensor fill side by side · moisture risk · outbound grade.
Inventory
61,800 bu
3.47M lb modeled
Active loads in bins
14
Awaiting bin
1
Scale house queue
Moisture alerts
1
High / critical bins
Sensor recon
2
0 alert · 2 watch
Sensor ↔ model reconciliation
Compares live bin fill (sonar) to ticket inventory. Large gaps = shrink, missing loads, or packing.
- North 1watch
Sensor 7.2 pts above model — check packing or missing outbound draw.
72% sensor · 65.8% model
+6.2 pts · ~1,740 bu gap
- West 4watch
Sensor 7.4 pts above model — verify scale tickets assigned.
61% sensor · 53.6% model
+7.4 pts · ~1,330 bu gap
Moisture insights
Commodity-aware spoil risk from weight-averaged in-bin moisture.
- watch
North 1
Avg 14.2% M · corn — monitor for heat if ambient rises
- low
East 3
Avg 13.6% M · stable layers, good ship window
- low
South 2
Avg 12.4% M · soybeans within target
Bin status · model vs sensor
Gold = tickets remaining. Blue = live sonar fill %. Large gaps mean shrink, packing, or missing loads.
North 1
Corn · 4 loads
18,420 bu
model · 65.8% of 28,000 bu
South 2
Soybeans · 3 loads
12,110 bu
model · 55.0% of 22,000 bu
West 4
Wheat · 2 loads
9,640 bu
model · 53.6% of 18,000 bu
East 3
Corn · 5 loads
21,800 bu
model · 72.7% of 30,000 bu
Recent loads
scale houseT-1124 · Corn
Supplier A · today 08:14
54,280 lb
in bin · 14.1% M
T-1123 · Soybeans
Supplier B · today 07:52
51,900 lb
in bin · 12.3% M
T-1122 · Corn
Regional co-op · today 07:21
55,100 lb
awaiting bin · 15.4% M
T-1121 · Wheat
Supplier C · today 06:48
48,200 lb
in bin · 13.0% M
T-1120 · Corn
Supplier A · today 06:11
53,760 lb
in bin · 13.8% M
Outbound
S-2201
Processor A · 102,400 lb · 14.0% M forecast
S-2200
Processor B · 98,800 lb · 12.5% M forecast
S-2199
Mill customer · 88,200 lb · 13.2% M forecast
Shipments →